This article was written by Jami Brooks, AuD, SLP, CCC-A, a HearingLoss.com®-Certified provider at Brooks Hearing Clinic located at Paris, Sulphur Springs, & Mount Pleasant, Texas.
An audiogram might seem complex, but understanding it is key to knowing the extent of your hearing loss and making informed decisions about your treatment.
This article breaks down how to read an audiogram, what the numbers and graphs mean, and how they translate to real-world hearing challenges.
What Is an Audiogram and Why Is It Important?
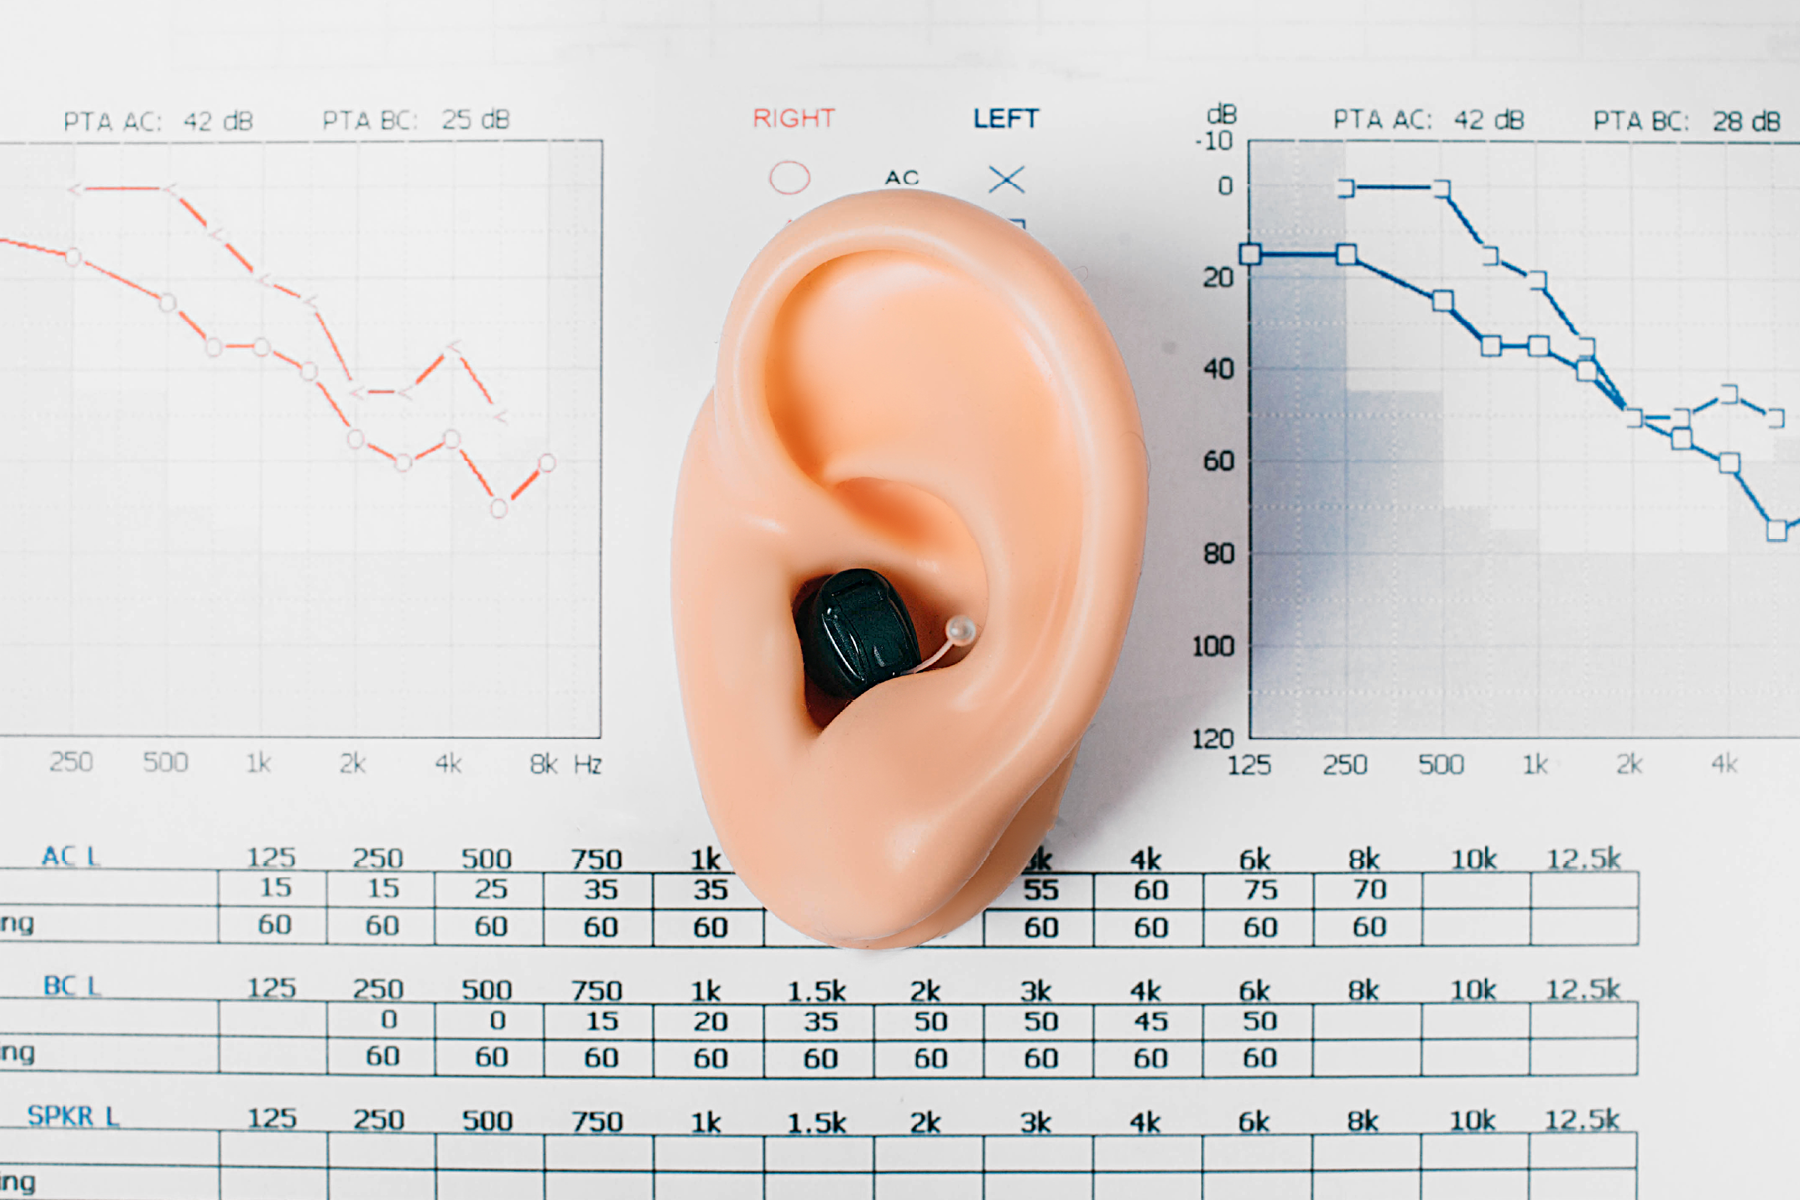
After you have your hearing screened, a process called pure-tone audiometry, the results are plotted on a graph called an audiogram.
The audiogram shows what pitches you can hear as well as the quietest volume at which you can hear them.
Your provider uses your audiogram to determine the type, degree, and configuration of your hearing loss.

Find a Certified Hearing Care Provider Near You
Your audiogram is just the beginning of understanding your hearing health. A hearing care provider can explain your results, answer your questions, and guide you toward the best treatment options.
How an Audiogram Measures Your Hearing Ability
For the purposes of this article, let’s streamline the audiogram a little bit — this is a lot of information to absorb!
The focus will be testing with headphones, called air-conduction testing, because the sound travels by air in your ear canal.
Another type, bone-conduction testing, is also usually performed, and those results also show up on your audiogram.
So what does an audiogram measure?
Pure-tone audiometry

In school or at the doctor’s office, did you ever have to put on headphones, listen for a beep, and raise your hand when you heard it? That’s pure-tone audiometry.
At an audiologist’s office, though, pure-tone audiometry is handled a little differently. You don’t simply sit in a chair near the person performing the test. You sit in a sound-proof booth with specialized headphones, which minimizes sound contamination. Your provider is outside the booth running the test.
Depending on the office, you respond to the sounds by raising a finger or hand or pressing a button. Each ear is tested separately.
The audiogram is based on your responses. It tells your provider a lot about frequencies and intensities — and your hearing loss.
What is frequency in hearing tests?
One thing being tested in pure-tone audiometry is the frequencies you can hear. Frequency simply means pitch, like when you say someone has a high-pitched voice.
One way to imagine frequency is a piano: The keys on the right are the high notes — the notes with a high frequency. The keys to the left are the low notes — the notes with low frequency.
Or consider the world around you: Thunder and car engines have low frequencies. Birds chirping and children’s voices have high frequencies.
Pure-tone audiometry tests you on a wide range of frequencies to see which ones you have trouble hearing.
What is intensity in hearing tests?
The other thing being tested is intensity, or loudness. Each frequency is played more and more quietly, and your audiologist wants to know how quiet a given frequency needs to be such that you can no longer hear it.
Why pure tones help detect specific hearing loss
Why is it called pure-tone audiometry?
Most sounds you hear are made up of many different frequencies. But hearing loss doesn’t affect all frequencies the same.
Using pure tones, which have only one frequency, lets us pinpoint exactly where you have hearing difficulties. They’re essential for getting an accurate diagnosis.
Put it all together
Your audiogram is a graph, with frequencies listed along the top and intensity along the side. Each point on the graph is either an X (for your left ear) or an O (for your right ear).
Every X or O on your audiogram is a piece of data that says, “This pitch was played, and below this volume it couldn’t be heard.”
Understanding Frequency and Intensity on Your Audiogram

Let’s unpack the audiogram a little more, starting with how we measure frequency and intensity.
What do hertz (Hz) tell you about hearing?
Frequency is measured in a unit called a hertz (Hz). The higher the hertz, the higher the frequency. A tone of 2,000 Hz has a much higher pitch than a tone of 100 Hz.
Remember how frequency was compared to a piano in the section above? That’s how the hertz measurements are arranged at the top of the audiogram — lower frequencies on the left, higher frequencies on the right.
Most speech is in the range of 250 Hz to 6,000 Hz. Pure-tone testing usually covers the range 250 Hz to 8,000 Hz.
What do decibels tell you about hearing?
Intensity is measured in decibels (dB). The higher the decibels, the louder the sound. A tone at 30 dB is much quieter than that same tone at 70 dB.
On an audiogram, the decibel measurements are small at the top and increase as you move toward the bottom of the page.
A normal conversation is about 60 dB. A gas-powered lawn mower is around 90 dB.
How to read the audiogram
What does this graph tell us?
Let’s say you hear a tone at 250 Hz. It gets quieter and quieter, until you can’t hear it at all. You could hear it at 20 dB, but not softer than that. It was just too quiet. And it was the same for each ear.
Your audiogram, then, shows a black X (left ear) and a red O (right ear) at the spot where 250 Hz and 20 dB meet. That 20 dB is your hearing threshold at 250 Hz — you can’t hear anything quieter at that pitch.
By the end of the test, you’ve heard tones at 250 Hz, 500 Hz, 1,000 Hz, 2,000 Hz, 3,000 Hz, 4,000 Hz, and 8,000 Hz. Your audiogram is a line starting at 250 Hz and crawling across the page to the right, a series of Xs and Os noting your hearing thresholds at each frequency.
They all hover on or just above 20 dB — until the line reaches 2,000 Hz. The line splits, and a red branch dips suddenly to 35 dB, marked by a red circle. The other branch dips more severely to 40 dB, and it’s marked by a black X.
That dip indicates (1) you have a hearing loss at 2,000 Hz, (2) it’s different in each ear, (3) and it’s worse in your left ear. The clue: 25 dB is considered the borderline for hearing loss. When a hearing threshold is greater than that, it means you no longer hear that frequency in the normal range.
Don’t Get Overwhelmed by Your Audiogram
Your audiogram is full of important details, but you don’t have to figure it out alone. When you meet with a Certified provider, they’ll walk you through your results step by step, explain what it all means, and help you understand your best next steps.
Types of Hearing Loss and What They Look Like on an Audiogram
Once you know what to look for, an audiogram can quickly tell you a lot. For example, certain telltale patterns reveal what type of hearing loss is present. Let’s see some examples.
High-frequency hearing loss audiogram shape and pattern
One of the most common types of hearing loss is high-frequency hearing loss. Age-related hearing loss and noise-related hearing loss are prime examples.
It occurs when the tiny, delicate structures in your inner ear responsible for high-frequency sounds become damaged and can’t send as much sound information to your brain. With this kind of hearing loss, you struggle to hear sounds like children’s voices, birdsong, and autumn leaves rustling.
On an audiogram, the graph looks like a hill: It’s straight starting at the top left and, somewhere between 1,000 Hz and 2,000 Hz, slopes downward sharply to the right.

The slope looks roughly the same for each degree of hearing loss, but for each degree, it sits in a different spot on the audiogram:
- Mild: The slope sits entirely between 25 dB and 40 dB on the graph
- Moderate: The slope sits entirely between 40 dB and 60 dB on the graph
- Severe: The slope sits entirely between 60 dB and 80 dB on the graph
- Profound: The top of the slope sits at 80 dB or greater
Low-frequency hearing loss audiogram shape and pattern
One of the less-common types of hearing loss is low-frequency hearing loss. With this type, the tiny, delicate structures in your inner ear responsible for low-frequency sounds become damaged and can’t send as much sound information to your brain.
With this kind of hearing loss, you struggle to hear low-frequency sounds such as thunder, car engines, and the bass guitar in music.
On an audiogram, the graph looks like the mirror image of high-frequency hearing loss: It’s straight starting at the bottom left and, somewhere between 1,000 Hz and 2,000 Hz, slopes upward sharply to the right. Because it’s the opposite of the much-more-common high-frequency hearing loss, it’s sometimes called reverse-slope hearing loss.

Next Steps: What to Expect After Your Hearing Test
Armed with the results of your hearing test, you and your audiologist will discuss everything on the audiogram. If it turns out you do have a hearing loss, you’ll discuss treatment options, such as hearing aids or cochlear implants.
You’ll explore the hearing devices that your provider thinks are the best option for your unique situation. This conversation will draw heavily on the conversations you and your provider had at the beginning of the appointment while discussing your listening lifestyle.
There’s a strong chance you’ll need to make an appointment to return and receive your devices — there are simply too many hearing aid manufacturers, styles, and colors to keep a bit of everything on hand at the office.
At that appointment, called a fitting appointment, you’ll learn all about how to use your devices, take care of them, and, if applicable, use the smartphone app associated with them.
How HearingLoss.com® Can Help You Find a Provider
HearingLoss.com can connect you with hearing professionals who are certified in using the most advanced diagnostic techniques — ensuring you receive precise, science-backed evaluations.
By choosing a HearingLoss.com-Certified provider, you can trust that your hearing assessment will go beyond basic screenings. These experts utilize comprehensive testing methods, including real-ear measurement and speech-in-noise testing, to tailor the best possible treatment for your unique hearing needs.
With the right knowledge and expert support, you can take control of your hearing health. Find a certified provider near you today, and take the first step toward clearer hearing and a better quality of life.
At Brooks Hearing Clinic, we believe that better hearing leads to a better life. Our knowledgeable, friendly team is here to help you hear and live your best life. Patients trust us with their hearing loss, tinnitus, and hearing aid needs. We personalize treatment to your specific needs, following clinical best practices and using cutting edge technology to ensure the best possible hearing results. Nothing is more important to us than helping you stay connected to what matters most in your world. Count on us to be by your side for every step of your better-hearing journey!
Book a Professional Hearing Evaluation
An online hearing screener is an important step, but it can’t replace a comprehensive hearing exam by a HearingLoss.com professional. Our goal is to deliver expert hearing loss solutions that improve your life.
Don’t wait! Find your local provider and request an appointment today.